

UKCS Flaring and Venting 2020 Report

The Oil and Gas Authority (OGA) is fully committed to supporting achievement of the UK’s net zero emissions target and is working with government and industry on the vital role that the oil and gas industry must play in the UK energy transition.
The OGA has signalled its intent to refresh its core aim to include a requirement for industry to help the government achieve the target of net zero greenhouse gas emissions by 2050 (consultation here). The OGA has committed to incorporate OGUK industry emissions reduction targets into OGA data benchmarking to track and monitor performance and progress. Both of these areas will require increased focus on flaring and venting and associated greenhouse gas emissions.
This report outlines the recent levels of flaring and venting activity associated with oil and gas production on the United Kingdom Continental Shelf (UKCS) and the contribution of this activity to greenhouse gas (GHG) emissions. It provides an indication of relative performance levels offshore by using peer groups to set benchmarks for typical flaring and venting volumes and resulting emissions.
Flaring and venting are controlled processes to dispose of waste gas, essential for emergency and safety purposes on oil and gas installations, and in situations where it may not feasible for the gas to be used, exported or re-injected. Flaring is the burning of gas, and venting is the release of unburned gas.
The OGA is encouraged by industry’s awareness of the need to deal with the serious issue of emissions caused by flaring and venting and is seeing evidence of positive action.
Data sources used in this report include: the OGA's Petroleum Production Reporting System (PPRS); the European Union Emissions Trading Scheme (EU ETS) Union Registry of verified carbon dioxide emissions; and the Environmental Emissions Monitoring System (EEMS). EEMS is maintained by the Offshore Petroleum Regulator for Environment and Decommissioning (OPRED) and is the environmental database of the UK oil and gas industry. The quality of these data can vary, however the OGA is working with industry and other key stakeholders to continuously improve this.
The detailed findings have been presented in this report as a series of Power BI Dashboards. These can be interacted with by toggling between flaring and venting statistics and to filter data, for instance, by year or by facility type.
Offshore Flaring and Venting Key Figures
Hover over icons to see more

-
Flaring offshore is the controlled combustion (without energy recovery) of natural gas and other fluids on the installation.
-
The main greenhouse gas emission resulting from this process is carbon dioxide.

-
Venting offshore is the release of natural gas directly to the atmosphere. This also includes instances where gas passes through the flaring mechanism unignited.
-
The main greenhouse gas resulting from this process is methane.
-
42 bcf of gas was flared from offshore production facilities on the UKCS in 2019.
-
4% decrease from 2018.
-
The average production facility flared 0.5 bcf of gas in 2019.
-
Majority of flaring is designated as Category 1 or Base Load Flare.
-
Flaring comprises a quarter of UKCS Scope 1 carbon dioxide emissions. Scope 1 emissions include all direct emissions from field operations, for example those from: flaring, venting, power generation and fuel combustion.
-
The UKCS flaring intensity and flaring emissions intensity in 2019 were 114 scf/bbl and 5 kgCO2/boe respectively.
-
0.7 bcf of gas was vented from offshore production facilities on the UKCS in 2019.
-
34% decrease from 2018.
-
The average production facility vented 23 mmscf of gas in 2019.
-
Venting is estimated to comprise around 1% of UKCS Scope 1 carbon dioxide emissions but around half of Scope 1 methane emissions.
-
0.05% of all produced gas in 2019 was vented.
Report Section Links
UKCS Gas Production
An estimated 1,560 billion cubic feet (bcf) of natural gas was produced from the United Kingdom Continental Shelf (UKCS) in 2019. Excluding gas which was injected back into the reservoir, 88% of produced gas was exported to market, with 9% being utilised offshore as a fuel. The remaining 3% of gas produced was flared or vented at the offshore installation for either safety, operational or economic reasons. Of that 3%, 98% of gas was flared and 2% was vented.
This composition has stayed relatively constant since 2012, with a slight decrease in the amount of gas being sent to export. This has been attributed to a decrease in production of dry gas and an increase in associated gas, the latter being primarily linked to gas flaring. Recent increases in associated gas production have come from new developments in the West of Shetland (WoS) region and both new and existing developments in the Central North Sea (CNS) region.


Dashboard 1
Associated Gas

-
Natural gas produced in conjunction with oil or liquid hydrocarbons from an oil or condensate field.
-
In the reservoir, associated gas exists either dissolved within the oil or as free gas in the gas cap.
-
Associated gas is generally considered a secondary product to oil.
Dry Gas

-
Natural gas produced from a gas field where there is little or no condensate or reservoir liquids.
-
Dry gas produced from a gas field is the primary commodity.
-
The majority of dry gas produced on the UKCS comes from Southern North Sea (SNS) gas fields.
Tap image to activate dashboard
UKCS Flaring
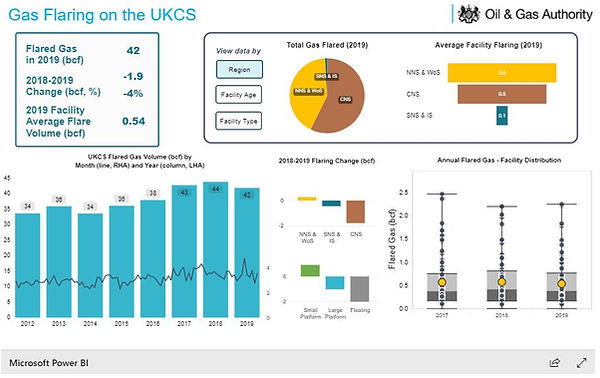
The volume of gas flared on the UKCS in 2019 was 42 bcf. The amount of flared gas decreased by 4% from 2018 to 2019, breaking a four year rising trend. Excluding facilities starting production in 2019 the overall reduction in flaring was approximately 13%. This difference is due to flaring associated with initial field start up. Reductions in flaring occurred in all regions except the WoS. The average production facility flared 0.5 bcf in 2019 and varied according to region, development type and facility age.
Dashboard 2
Tap image to activate dashboard
Sources of Flaring
As part of the Oil and Gas Authority's consenting process there are three defined categories of flaring. These are:


Category 1: Base Load Flare
This includes all the gas used for safe and efficient operation of the process facility and flare system under normal operating conditions.
Category 2: Flaring from Operational or Mode Changes
This includes gas flaring resulting from the start up and planned shut down of equipment during production.
Category 3: Emergency Shutdown/Process Trip
This includes any gas flared during an emergency.
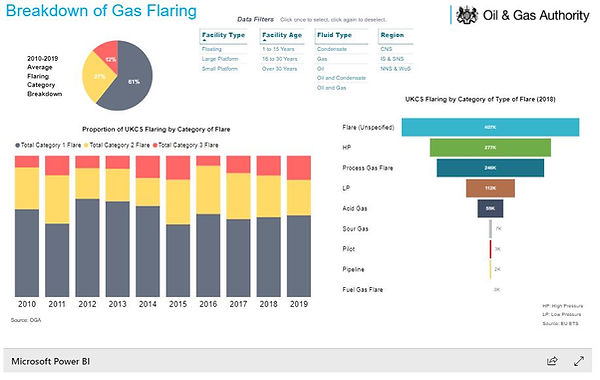
Roughly 60% of flaring offshore falls under the Category 1 or Base Load Flare definition. Typical examples of Category 1 flaring are all process purges and pilots, the off-gas from glycol regeneration plants and acid gas discharged from methyldiethanolamine (MDEA) and other gas treatment plants, where these are fed to the flare system for combustion. This category also includes flaring from installations with no gas export facilities.
Category 2 comprises around 30% of flaring. This is flaring associated with the planned shutdown of equipment, and will also include gas not meeting export specifications and equipment outages. This category covers flaring that is caused by the temporary lack of access to a third-party gas export route.
The remaining ~10% of flaring is categorised as Category 3. This includes any gas flared during an emergency shut down or process trip of equipment on the installation, including shut-in of the wells.
Please find more information about the OGA's flaring and venting consents policy, processes and considerations at this link.
Dashboard 3
Tap image to activate dashboard
UKCS Venting
On a volumetric basis, facilities on the UKCS flare rather than vent the vast majority of produced gas released to the atmosphere. Nevertheless, monitoring of vented gases is crucial due to the high Global Warming Potential (GWP) of their predominant GHG emission: methane.
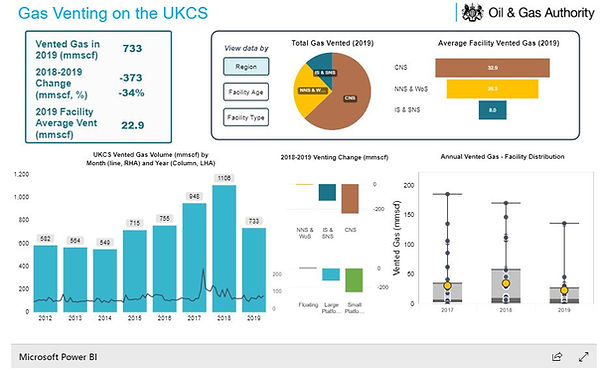
In 2019, 733 mmscf (million standard cubic feet) of gas was vented to atmosphere. This was a decrease of 34% from 2018. All regions experienced decreases except the WoS which saw a minimal increase. There was a fairly even split between the number of facilities increasing or decreasing their volume of vented gas, however the average decrease was around four times the average increase. In 2019, the average facility vented 23 mmscf of gas, a decrease from the 2018 average of 35 mmscf.
Of the gas vented, an estimated 98% was comprised of gaseous hydrocarbons with the remaining 2% being comprised of non-hydrocarbon gases including carbon dioxide, nitrous oxide and volatile organic compounds. This gas composition varies throughout the North Sea due to differences in reservoir fluids and topsides processes.
Some of the reported venting values will include gases vented via cold flaring. This process is where natural gas passes through an unlit flare system to the atmosphere. The OGA is actively working to improve the understanding of cold flaring levels.
Dashboard 4
Tap image to activate dashboard
Flaring and Venting Benchmarking
In 2019, for every barrel of oil and condensate (bbl) that was produced on the UKCS, 114 scf of gas was flared. This flaring intensity has fallen for two consecutive years from a high of 129 scf/bbl in 2017. This has been due to both an increase in oil production and a fall in flaring (in 2019). This measure of flaring intensity can be used as a benchmark to compare facilities, facility types, regions and operators. When using this metric, factors need to be taken into consideration when assessing performance, such as facility life cycle stage, produced fluid composition and available export infrastructure.


1 BBL PRODUCED
114 SCF GAS FLARED
=
2019 UKCS Flaring Intensity
Another benchmarking metric to assess flaring performance is the amount of gas flared as proportion of associated gas produced. The UKCS value for this in 2019 was 4%. This value has stayed relatively constant at a UKCS level, not varying by more than one percentage point since 2012.
For benchmarking venting performance, the amount of gas vented as a proportion of total gas (associated and dry) produced can be used as a metric. The UKCS vented 0.05% of all gas produced in 2019.

Dashboard 5
Tap image to activate dashboard
Flaring and Venting GHG Emissions
Flaring activity is estimated to make up just under a quarter of all Scope 1 carbon dioxide emissions generated from oil and gas operations on UKCS facilities. In total GHG (carbon dioxide equivalent) terms, the value is roughly 25%. Venting activity contributes an estimated 1% of Scope 1 carbon dioxide emissions, roughly half of methane emissions and 5% of total GHG emissions from UKCS facilities.

Dashboard 6
Tap image to activate dashboard
Flaring Emissions Benchmarking
Analysing available flaring and emissions data on a facility level allows a relationship to be established between the amount of gas flared and the amount of resulting carbon dioxide emissions. This ratio varies depending on the composition of the gas being flared and the combustion efficiency of the flaring process. Flared gas usually has a very high (>90%) hydrocarbon content, with the remaining few percent being comprised of other compounds, for example carbon dioxide and hydrogen sulfide. The observed relationships below suggest that for every tonne of gas flared, there are between 2 to 3 tonnes of resulting carbon dioxide emissions.

Dashboard 7
Tap image to activate dashboard
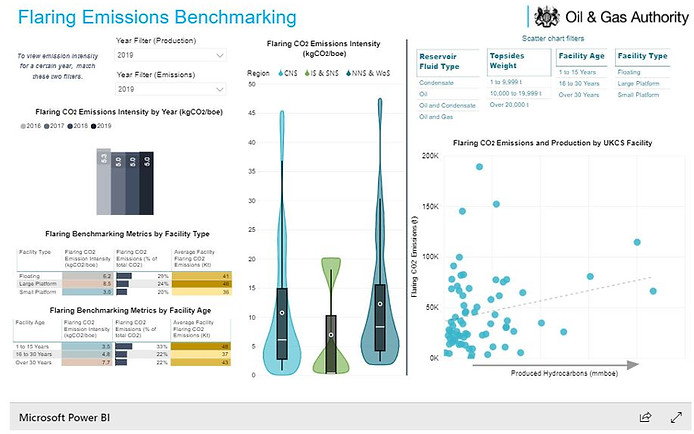
In 2019, the carbon intensity of flaring activity on the UKCS was 5 kgCO2/boe (kilograms of carbon dioxide per barrel of oil equivalent of sales production). This was a very minor (<1%) increase from 2018. This value differs significantly between facility age and type, with small platforms averaging 3 kgCO2/boe and facilities over 30 years old averaging 8 kgCO2/boe. The average facility in 2019 emitted 40 kilotonnes (kt) of CO2 from flaring.
At present, benchmarking individual facilities on their methane emissions will have limited effectiveness due to inconsistencies in assessment standards and calculation methods across the UKCS for methane emitted through vents (including cold flaring), flaring (uncombused natural gas) and fugitives. The development of a consistent methane dataset covering all emission sources is a key area of work going forward.
Dashboard 8
Tap image to activate dashboard
OGA Actions and Next Steps
The OGA works with operators as part of its consents regime on flaring and venting of gas throughout the lifecycle of a petroleum installation. In support of the government’s net zero 2050 target, the OGA is working to take a more robust stance on flaring and venting through exploring its consents, field development process and project stewardship activities, to push for reductions in flaring and venting and the resulting greenhouse gas emissions.
To achieve this goal, in addition to the analysis in this benchmarking report and the proposals to refresh its core aim (as set out in the OGA Strategy consultation), the OGA has initiated a programme of work to:
-
Improve the quality and scope of data collected on flaring and venting
-
Build on the analysis presented here and use rigorous benchmarking, including through international comparisons, to drive continuous improvement in flaring and venting practices
-
Explore options to improve and be more robust with its consenting process, along with issuing new supporting guidance to industry
-
Explore the deployment of abatement technology options and use its powers across the lifecycle of an oil and gas development to lower emissions where possible.
-
Incorporate Oil and Gas UK industry emissions reduction targets into OGA data benchmarking to track and monitor performance and progress.
Notes
-
Global Warming Potential (GWP) Factors of 25 and 298 have been used for methane and nitrous oxide respectively. These figures are consistent with the Fourth Assessment Report of the United Nations Intergovernmental Panel on Climate Change.
-
Metering of flaring poses challenges due to the large range of operating conditions associated with the process. Flared gas values reported here represent operators' best estimates.
-
Greenhouse gases resulting from flaring activity are mainly calculated rather than measured due to the inherent technical difficulties involved in metering flared exhaust gases. Values are generally calculated using emissions factors and gas composition and combustion efficiency assumptions. Further details about this can be found at the following links for EEMS atmospherics data and ETS data respectively.
-
The issues listed in the above two points show the relatively high level of uncertainty present within these datasets. Findings presented here signify high level trends and behaviours.
Glossary of terms
bcf
boe
CH4
CO2
CO2e
Cold Flaring
GHG
Glycol regeneration
GWP
Large platform
Methyl diethanolamine
mmscf
Pilot flare
Purge
Scope 1 emissions
Small platform
Sour Gas
scf
Billion (standard) cubic feet of gas
Barrel of oil equivalent
Methane
Carbon dioxide
Carbon dioxide equivalent
Vented hydrocarbon gas emissions that should normally be combusted at the flare tip
Green-house gas
A system for the removal of water from natural gas and natural gas liquids (NGL)
The warming caused by any greenhouse gas, as a multiple of the warming caused by the same mass of carbon dioxide.
Platforms where the jacket weighs 10,000 tonnes or more. Includes a small number of concrete gravity based structures.
A derivative of ammonia used to remove acidic gases from natural gas streams.
million (standard) cubic feet of gas
A small amount of gas introduced into a flare tip that provides a flame to ignite further relieved gas.
Gas introduced between a flare header's water seal and the flare tip to prevent oxygen infiltration (backflow) into the flare tip.
Direct emissions from owned or controlled sources. In the context of the UKCS, this includes all emissions originating from offshore facilities.
Platforms where the jacket weights less than 10,000 tonnes.
Natural gas containing a high content of hydrogen sulfide.
Standard cubic feet. A cubic foot of gas at atmospheric pressure and a temperature of 15 degrees celsius.